
KEY ECONOMIC AND VALUE CONSIDERATIONS IN THE U.S. MARKET FOR PLASMA PROTEIN THERAPIES
In February 2018, Bates White Economic Consulting published a paper, Key economic and value considerations in the U.S. market for plasma protein therapies, authored by Professor Henry Grabowski of Duke University and Dr. Richard Manning of Bates White Economic Consulting. This paper analyzes the unique economic characteristics of plasma protein therapies (PPTs) and highlights their value in saving and improving patient lives. Several important findings should be considered by policymakers:
“…it is important that policymakers understand the unique contributions of and challenges facing [the plasma protein therapeutics industry]. As policy proposals move forward, it is important to avoid a “one size fits all” approach that will ultimately result in higher health care costs and adversely affect patient health.”
“Arguably the most important attributes of PPTs are the benefits they provide to the patients who use them. PPTs extend life expectancy, increase quality of life, and decrease complications related to conditions. Without these treatments, many patients would either not be able to survive or would have a substantially diminished quality of life and productivity.”
“From a cost-effectiveness perspective, the evidence suggests that prescribing physicians should have the flexibility to choose the most appropriate therapy for their patients based on each individual’s unique conditions and tolerability profile.”
In the U.S., the government pays for a large share of plasma protein therapy (PPT) utilization through Medicare Part B. Prices paid under Part B are determined according to the average sales price (ASP), reported quarterly to the Centers for Medicare and Medicaid Services (CMS) by manufacturers. ASP is the benchmark rate that Medicare uses to reimburse hospitals, clinics, or physicians for these products and is based on the volume-weighted average price received by manufacturers after accounting for discounts offered to payers.1 ASP rates can serve as a reliable indicator for the trend in these products’ prices over time. The following figures illustrate ASPs for various PPT product categories.2 These charts show indexed ASPs as well as changes in the producer price index (PPI) for pharmaceutical preparations.3 An ASP line below the PPI line suggests PPT product prices grew less than the drug price inflation benchmark.4
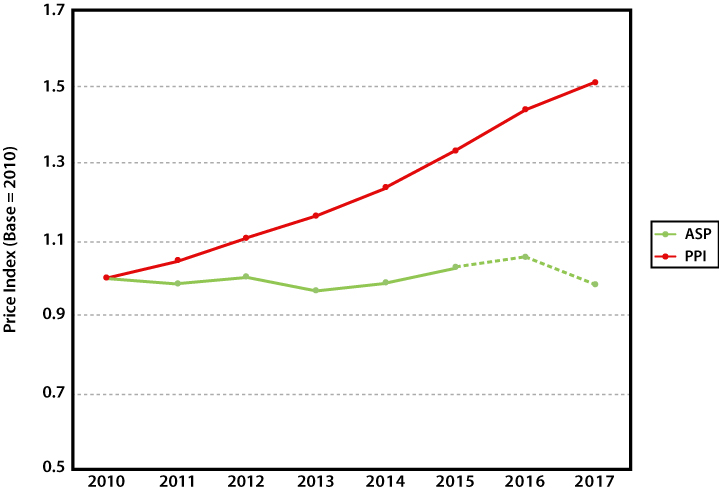


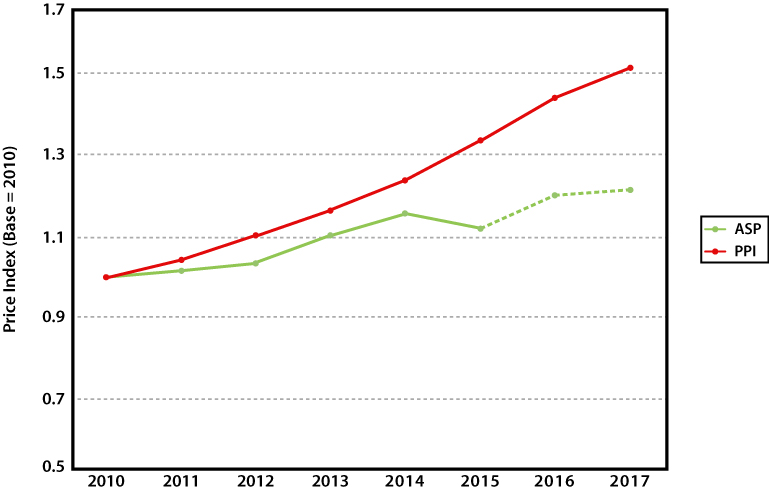
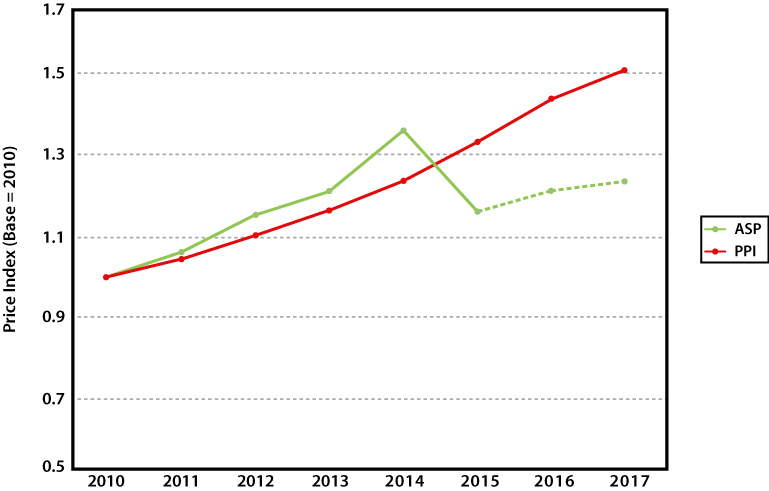
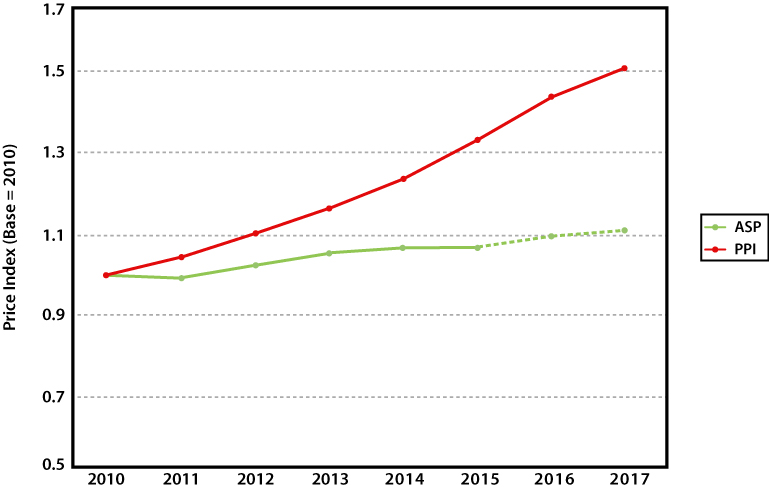
Medicare Part B providers are reimbursed at a rate of ASP + 6% for these products. Budget sequestration, which was put into effect in 2013, had the effect of reducing the reimbursement rate to ASP + 4.3%.
In most (if not all) cases, the price trend shown in these figures is a combination of individual product ASPs weighted by their respective Part B utilization as reported by CMS through 2015. At the time of this writing, utilization data were not available for 2016 and 2017. The trends reported here are projected by carrying forward the observed Part B utilization in 2015 and reflected by the dashed (versus solid) line.
The ASPs in these charts are indexed, meaning they represent the relative change in price over time in relation to the ASP for the base year. The producer price index measures the average change over time in the selling price received by domestic producers for their products. See: https://www.bls.gov/ppi/. The indexed PPI represents the change in PPI relative to the PPI of the base year and can be used as a benchmark of inflation in prescription drug production costs. The National Summary Data File is available through the CMS website: https://www.cms.gov/Research-Statistics-Data-and-Systems/Downloadable-Public-Use-Files/Part-B-National-Summary-Data-File/Overview Volume data are only available through 2015.
It should be noted that the changes in the PPI over time may not consistently capture discounts and rebates paid by manufacturers.